I got my hands on a dataset of 5,000 fresher job applications across India and decided to do what I always do — pull it apart. 68 companies, 56 colleges, 14 sectors, 30 job roles, and four years of application data (2021–2024). The question was simple: what actually matters in fresher hiring?
The answer, as it turns out, is “nothing individually.” No single factor — CGPA, college tier, referrals, internships — dramatically changes your odds. Hiring is a multi-dimensional evaluation, and the data proves it. Here’s everything I found.
The dataset at a glance
- 5,000 candidates with 30 attributes each — demographics, academics, skills, application details, hiring outcomes, LinkedIn profiles, and salary offers.
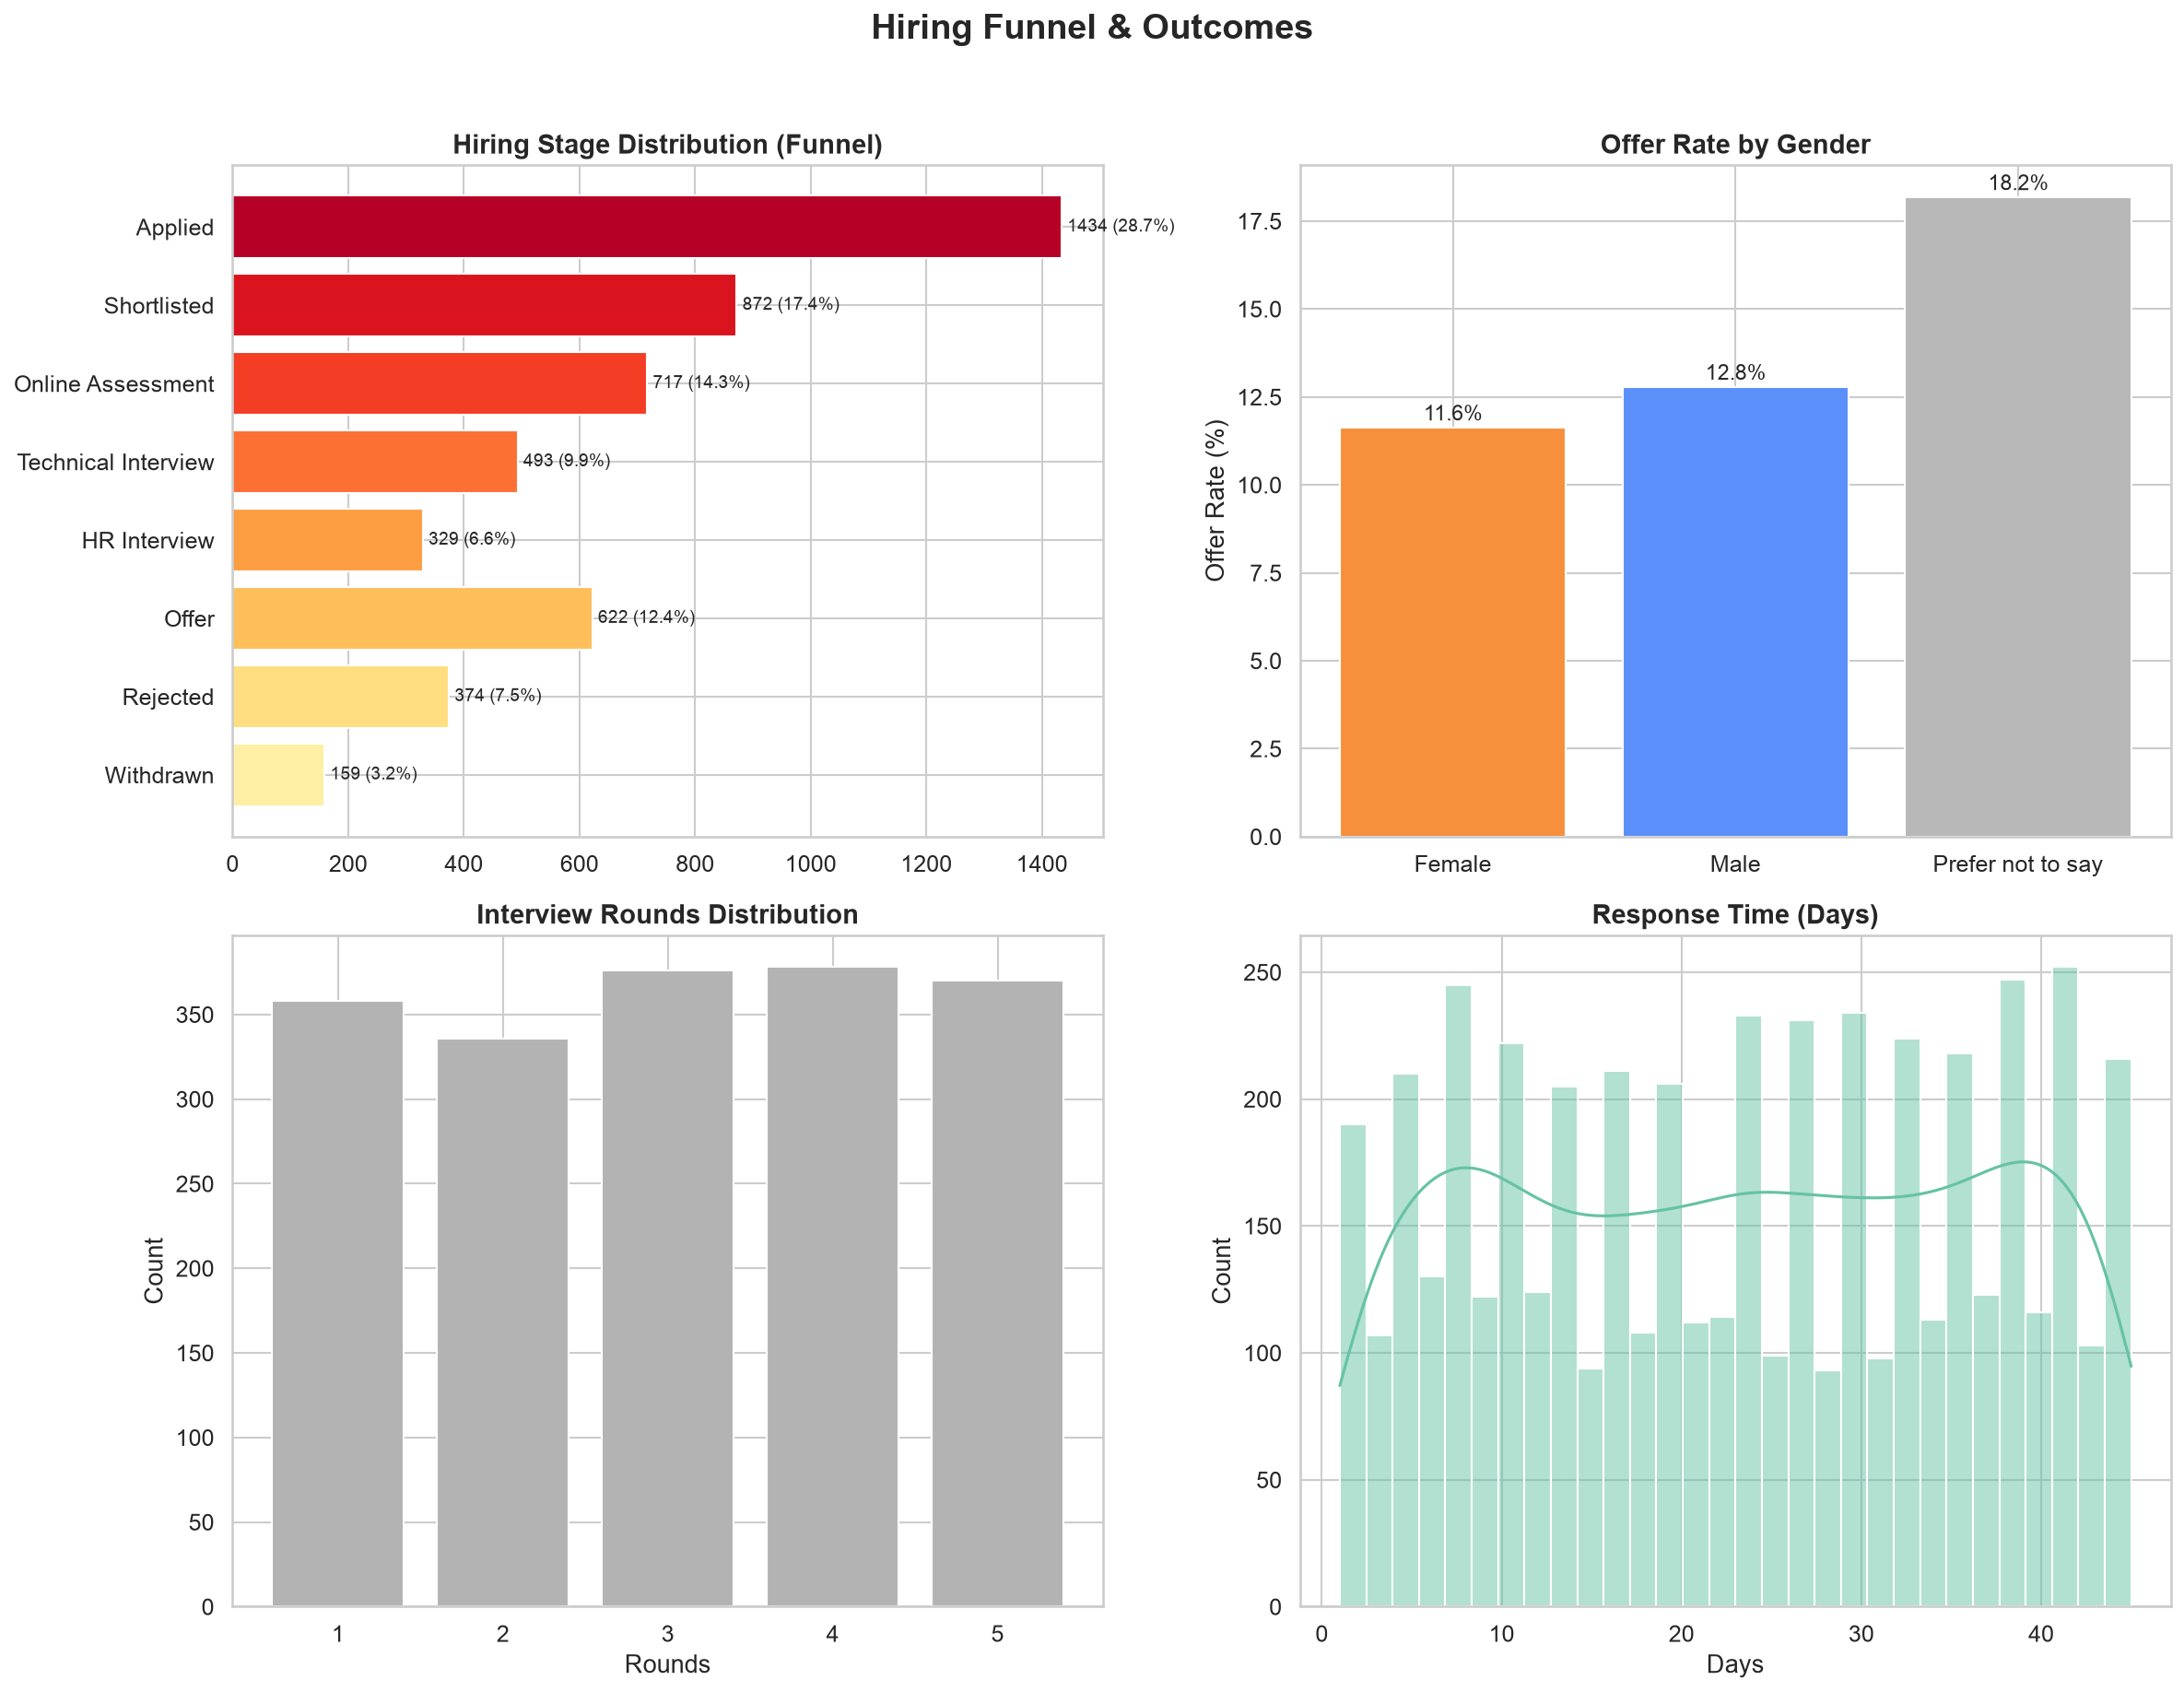
- 622 offers made (12.4% offer rate), 374 rejections (7.5%), 159 withdrawals (3.2%), and 3,845 candidates still somewhere in the pipeline.
- Zero duplicates, minimal missing data except for interview rounds (36% missing) and offered salary (87.6% missing — only offered candidates have salary data).
Demographics: who’s applying?

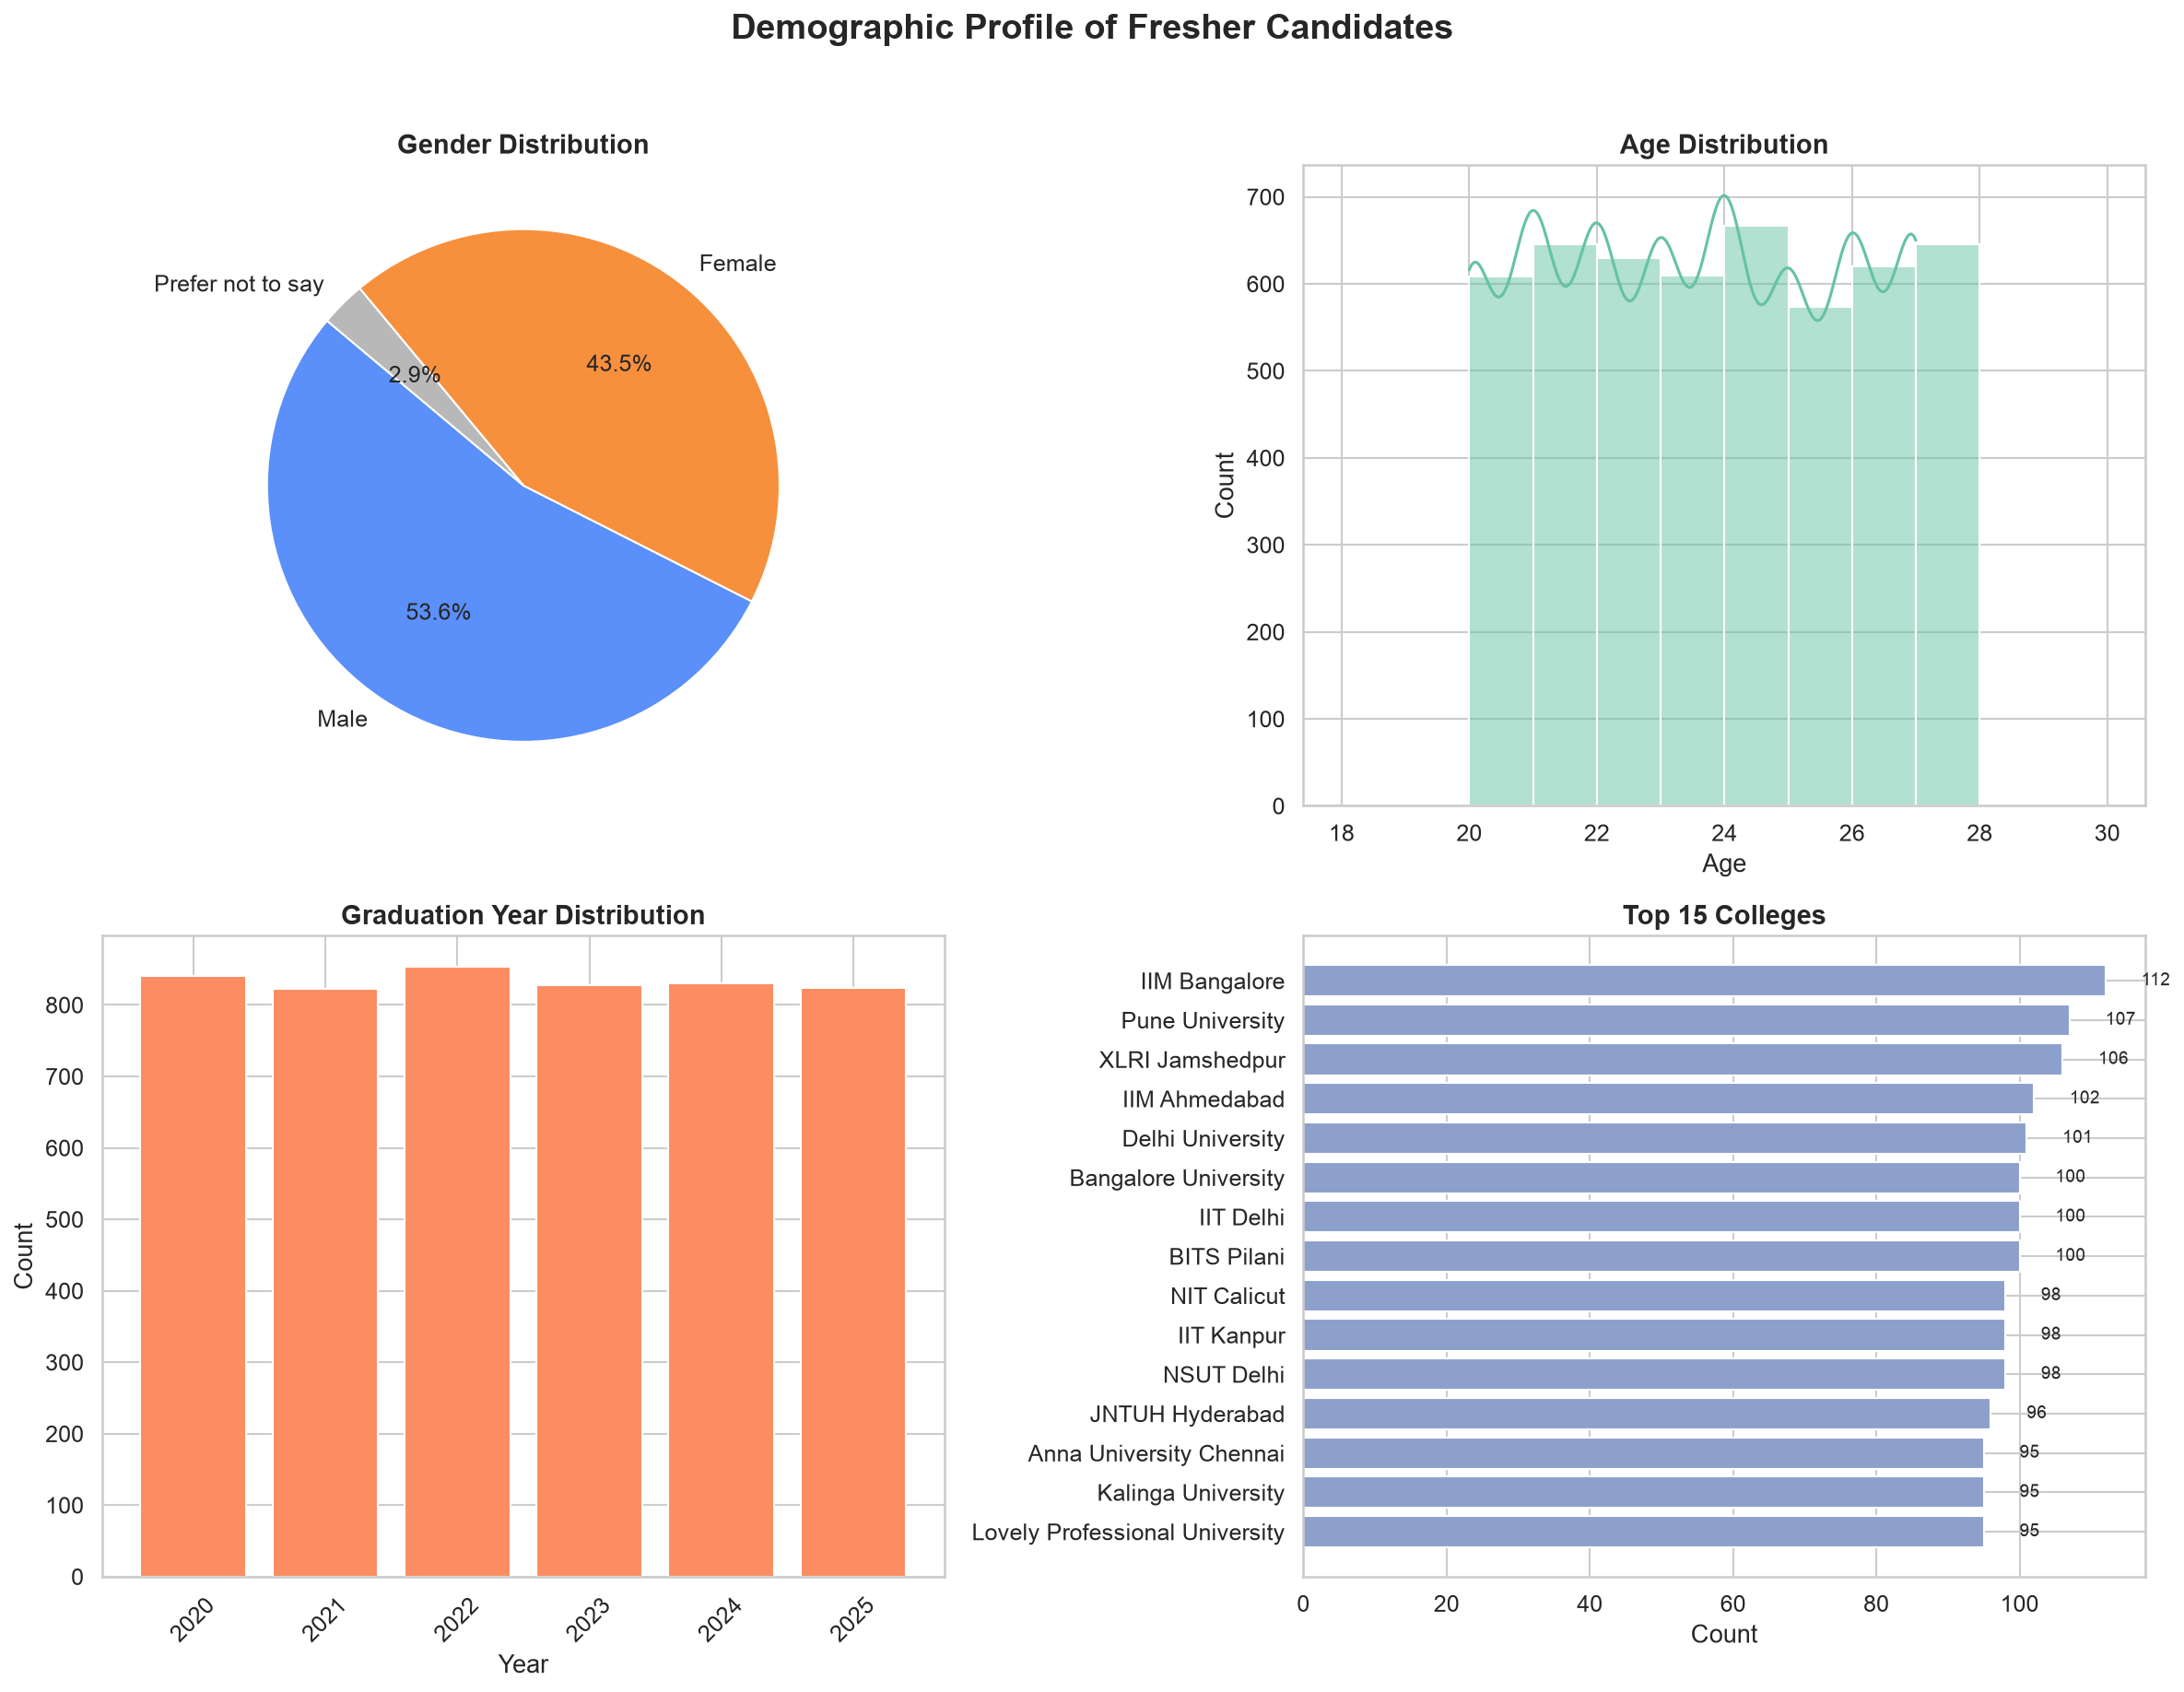
The gender split is 53.6% male, 43.5% female, and 2.9% who preferred not to say. Ages range from 20 to 27 with a mean of 23.5. Graduation years peak at 2024, with a steady spread from 2020 to 2025. The top colleges are a mix of IITs, NITs, VIT, SRM, and state universities — the dataset has good representation across tiers.
Academic profiles

CGPA averages 7.74 with a normal distribution (std 1.30). Degrees are surprisingly evenly spread — B.E. (555) narrowly leads BBA (536) and B.Tech (523). 25% of candidates have zero backlogs; the mean is 1.5. Computer Science and IT dominate the branch list, but there’s healthy representation from Mechanical, Electrical, and even Marketing and HR.
The hiring funnel

28.7% of candidates are stuck at the “Applied” stage — they never even got shortlisted. Only 12.4% make it to an offer. The funnel narrows sharply: Applied (1,434) → Shortlisted (872) → Online Assessment (717) → Technical Interview (493) → HR Interview (329) → Offer (622).
Average response time is 23.2 days, with a median of 24. Gender-wise, offer rates are close: 12.8% for males, 11.6% for females. The “Prefer not to say” group has a higher rate at 18.2%, but the sample size is small (143 candidates).
Salary analysis

Of the 622 offers, the mean salary is ₹4.92 LPA with a median of ₹4.90 LPA. The range is massive — from ₹8,098 (likely a monthly stipend for an internship) to ₹19.26 LPA. The distribution is fairly uniform, not the bimodal shape you might expect.
- Top-paying sectors: Automotive (₹5.95L median), Retail (₹5.87L), AgriTech (₹5.76L)
- Top-paying roles: Product Manager (₹14.5L!), Full Stack Developer (₹9.4L), DevOps Engineer (₹8.5L), Backend Developer (₹7.95L), Software Engineer (₹7.69L)
- Gender pay gap: Marginal — male median ₹4.88L vs female ₹4.80L
Salary deep dive: what drives compensation?

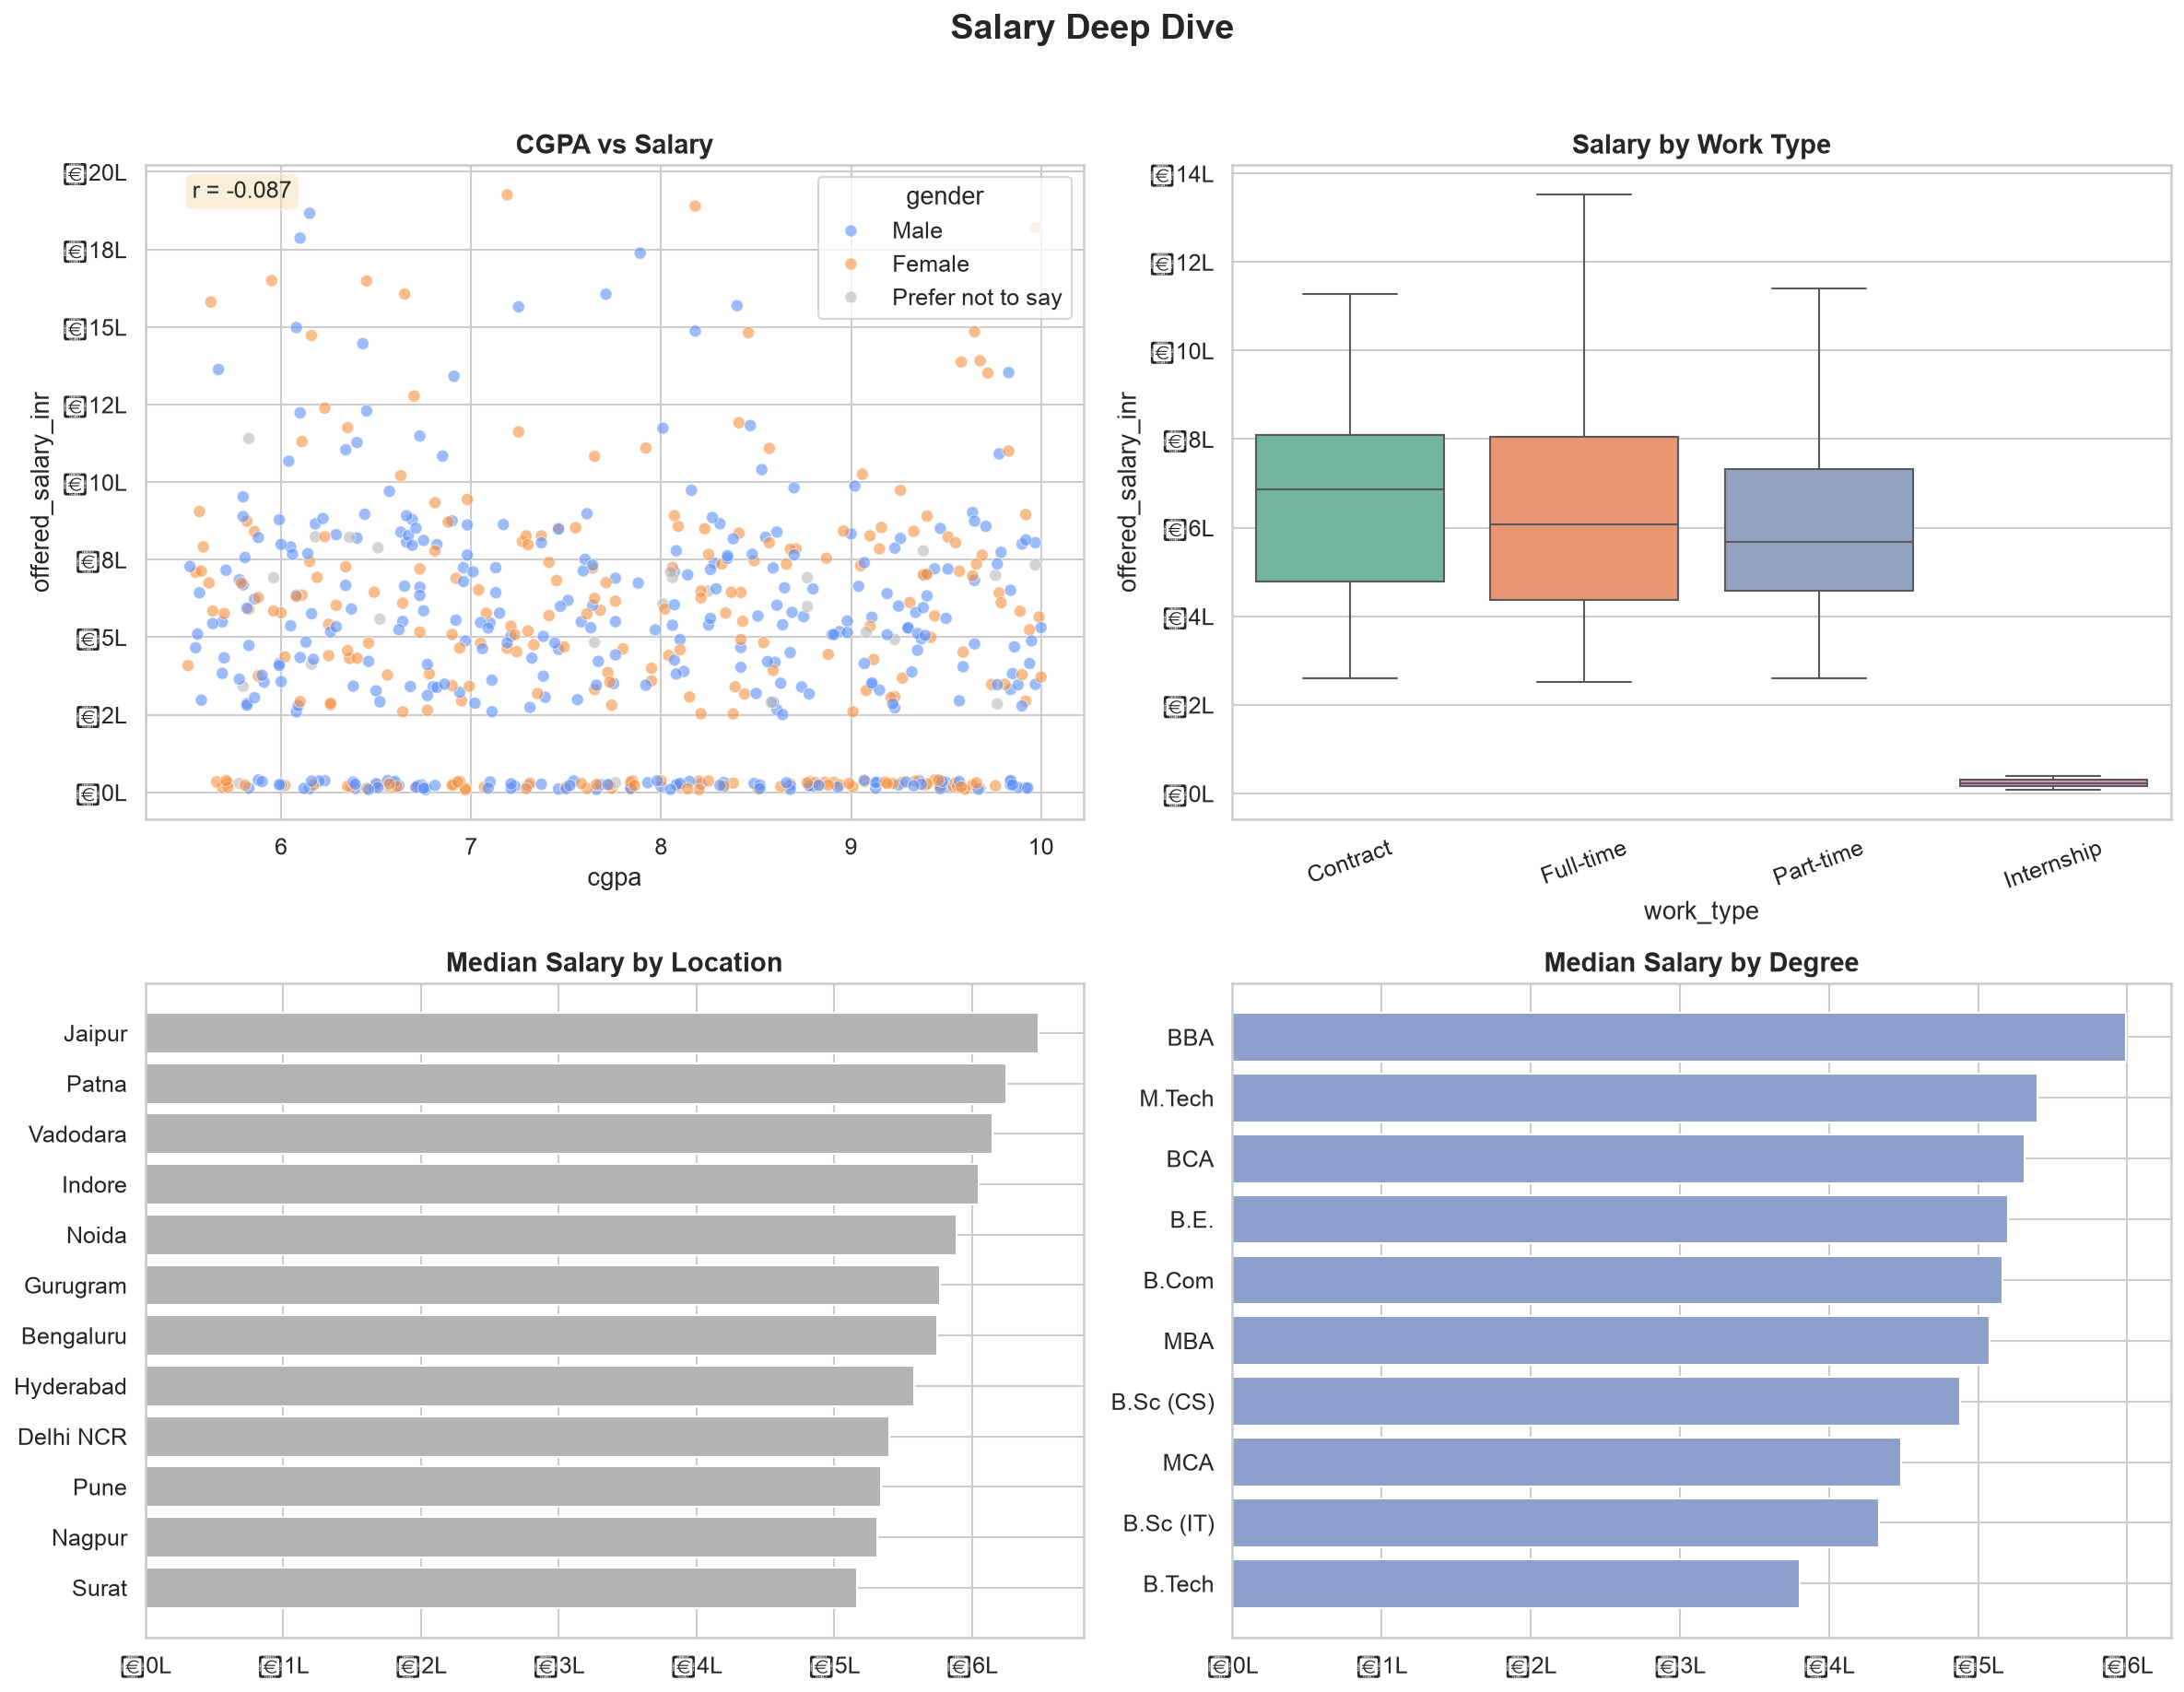
Here’s where it gets interesting. The CGPA-salary correlation is −0.087 — essentially zero, and slightly negative. A 9.0 CGPA doesn’t predict a higher salary than a 7.0. This is one of the most important findings: CGPA barely matters for compensation once you clear the screening threshold.
- Work type matters most: Contract roles pay the highest median (₹6.86L), followed by full-time (₹6.07L). Internships pay ₹23K — as expected.
- Location surprise: Jaipur tops the list at ₹6.49L median, followed by Patna (₹6.25L) and Vadodara (₹6.15L). Bengaluru (₹5.75L) ranks 7th.
- Degree impact: BBA holders earn the highest median (₹5.99L), while B.Tech is the lowest at ₹3.81L. The sample sizes vary, but it challenges the “engineering degree = higher salary” assumption.
Skills landscape

48 unique skills across the dataset. The most commonly listed are Linux (8.4%), MATLAB (8.1%), REST APIs (7.8%), JavaScript (7.8%), and Azure (7.8%). Skills are remarkably evenly distributed — no single skill dominates.
But which skills command the highest salaries?
- Highest-paying: Azure (₹6.52L), MongoDB (₹6.23L), Laravel (₹6.06L), Cybersecurity (₹5.90L), React (₹5.86L), Node.js (₹5.76L)
- Lowest-paying: REST APIs (₹2.95L), Hadoop (₹2.96L), Leadership (₹3.02L), Spark (₹3.40L), AWS (₹3.36L)
The “Leadership” and “Teamwork” soft skills sitting near the bottom is telling — listing generic soft skills on your profile doesn’t correlate with higher pay. Specific technical skills like cloud platforms and modern frameworks do.
Where are people applying from?

LinkedIn dominates with 1,099 applications (22%), followed by Naukri (959) and Indeed (472). But the best offer rates come from WorkIndia (16.1%), Referral (15.4%), and Internshala (14.4%). LinkedIn’s offer rate is 12.7% — close to average.
Top companies by offer rate (minimum 20 applications): BigBasket (26.8%), HCL Technologies (22.1%), Texas Instruments (21.7%), Uber India (20.0%), Qualcomm India (20.0%). Amazon leads in volume with 91 applications and a 17.6% offer rate.
What factors actually impact hiring?

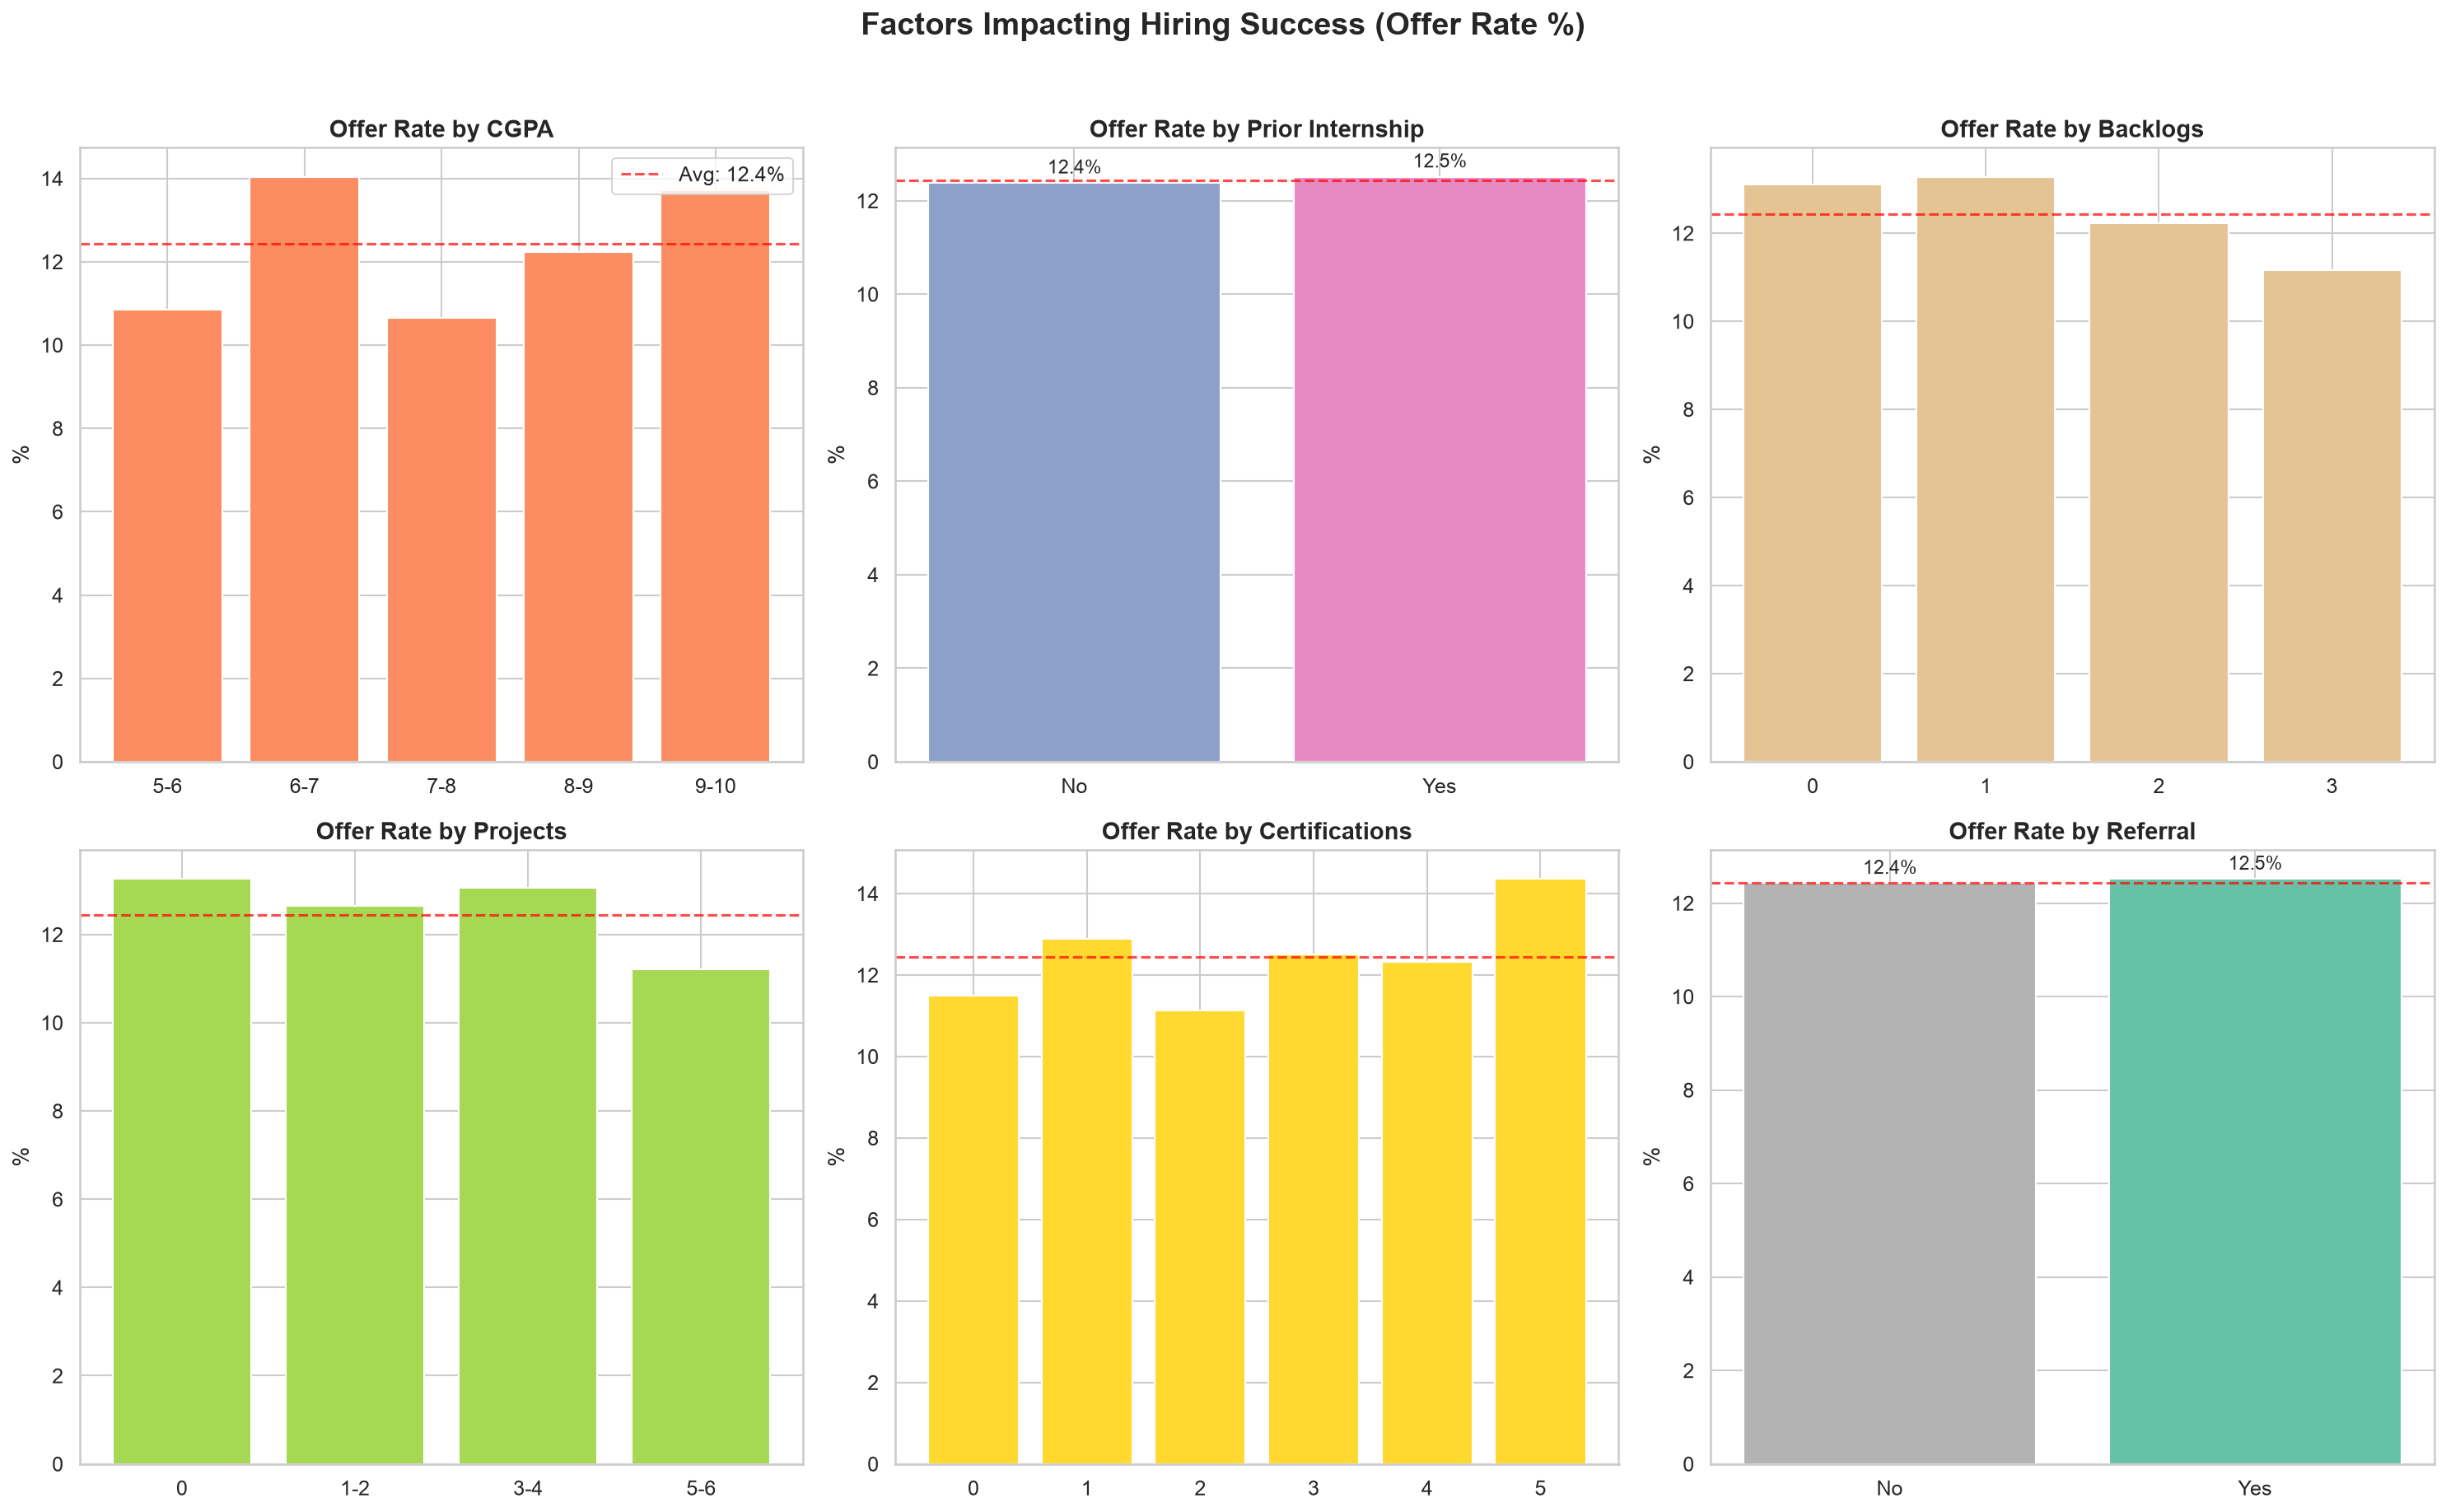
This is the chart that surprised me the most. The overall offer rate is 12.4%, and almost every factor hovers within ±2% of it:
- CGPA: 6–7 range has the highest offer rate (14.0%), not the 9–10 range (13.7%). The 7–8 range is actually the lowest (10.6%).
- Prior internship: 12.5% vs 12.4% — virtually no difference.
- Referral: 12.5% vs 12.4% — again, nearly identical. The referral advantage, at least in this dataset, is a myth.
- Backlogs: Slight negative trend — 0 backlogs (13.1%) vs 3 backlogs (11.2%). Minor but directionally expected.
- Certifications: 5 certifications have the best rate (14.4%), but the relationship isn’t linear.
The takeaway: no silver bullet exists. Hiring is holistic, and optimising a single variable won’t meaningfully change your odds.
LinkedIn and profile impact

- LinkedIn Premium: 14.2% vs 12.3% offer rate — a small edge, but based on limited data (only 1,099 candidates disclosed premium status).
- Gap year: Slightly hurts — 11.0% vs 12.6%. Not devastating, but measurable.
- Low connections (0–200): Surprisingly the highest offer rate at 17.7%. Quality over quantity, or these candidates are applying through more targeted channels.
- Profile completion: Minimal impact across all buckets (12.1%–12.7%).
Correlation matrix

Every single correlation with the offer outcome is below 0.03 in absolute value. Backlogs have the “strongest” negative correlation at −0.023. This mathematically confirms what the bar charts showed: no single numeric feature predicts hiring success. The decision is multi-factorial and likely involves qualitative factors this dataset doesn’t capture — interview performance, communication skills, cultural fit.
Temporal trends

Applications grew significantly from 2021 to 2024, with a sharp uptick in 2024. Monthly patterns show some seasonality — useful for timing your applications if you want to play the odds.
Work type and location

Full-time dominates at 54.8% of applications, followed by internships (28.1%). Contract roles have the highest offer rate (14.0%), possibly because there’s less competition. Lucknow leads in offer rate (16.2%), followed by Delhi NCR (15.1%) and Hyderabad (14.3%).
Sector hiring patterns

This heatmap shows how each sector distributes candidates across hiring stages. E-commerce, Banking & Finance, and Telecom are the most active sectors. The distribution patterns are remarkably similar across sectors, suggesting that hiring processes are standardised regardless of industry.
The college tier myth

This might be the most counterintuitive finding. I classified colleges into three tiers: Tier 1 (IIT/IIM/NIT/BITS/IIIT), Tier 2 (VIT, SRM, COEP, etc.), and Tier 3 (everything else).
Tier 1 colleges have the lowest offer rate at 10.9%. Tier 2 leads at 13.8%, and Tier 3 is at 13.2%. Median salary follows a similar pattern — Tier 2 (₹5.09L) > Tier 1 (₹4.83L) > Tier 3 (₹4.61L).
The likely explanation: candidates from top colleges aim for more competitive roles and companies, lowering their conversion rate. Or they’re more selective and withdraw more often. Either way, the data challenges the “tier 1 college = guaranteed placement” narrative.
Offered vs not-offered: the profile comparison

The profiles are nearly identical. Offered candidates have marginally higher CGPA (7.77 vs 7.74), slightly fewer backlogs (1.43 vs 1.51), and a touch more certifications (2.59 vs 2.48). The differences are statistically insignificant. This reinforces the central finding: hiring is not a formula.
Key takeaways
- CGPA is a threshold, not a predictor. Once you’re past the screening filter, a higher CGPA doesn’t correlate with better outcomes or higher pay.
- Specific technical skills pay more than soft skills. Azure, MongoDB, React, and Cybersecurity command salary premiums. “Leadership” and “Teamwork” on your profile add nothing measurable.
- Referrals don’t matter as much as you’d think. The offer rate difference is 0.1 percentage points. Focus on the application quality, not the channel.
- Product Manager is the highest-paid fresher role at ₹14.5L median — nearly 3× the overall median.
- Tier 1 colleges have lower offer rates than Tier 2 and Tier 3 — college name alone isn’t the advantage people assume it is.
- BigBasket, HCL, and Texas Instruments have the highest offer rates (>20%) among companies with 20+ applicants.
- Contract roles pay more than full-time at the fresher level (₹6.86L vs ₹6.07L median).
Methodology
Analysis was done in Python using Pandas, NumPy, Matplotlib, and Seaborn. The dataset contained 5,000 rows with no duplicates. Missing values were handled contextually — salary analysis only includes candidates with offers, LinkedIn Premium analysis only includes candidates who disclosed their status. College tier classification used keyword matching against known institution name patterns. All 15 visualisations were generated programmatically.